
Transformar Datos de Investigación en Historias Visuales que Impulsan Decisiones Empresariales
Autor: Jaikishan Verma, Senior Research Analyst
28 de mayo de 2026
ABRIL DE 2026

De números a narrativas: Convierte los datos en historias visuales
En el escenario actual, la disponibilidad de datos por sí sola no es suficiente, ya que la forma en que se presentan los conocimientos también desempeña un papel fundamental para ayudar a las empresas, los inversores, etc., a comprender fácilmente hallazgos complejos.
Las tareas complejas, como los hallazgos de datos, la conversión de datos y su encuadre en gráficos y elementos visuales, se realizan con la ayuda de herramientas de IA. Estas herramientas mejoran la calidad de la presentación, ahorran tiempo y hacen que los resultados de la investigación sean más atractivos. Sin embargo, la experiencia humana sigue siendo esencial para garantizar la precisión, el contexto y una narración significativa en consonancia con la investigación.
1. Infogram / Visme: Paneles e infografías interactivas
Qué hace:
Estas herramientas ayudan a convertir los resultados de la investigación en infografías, informes y paneles visualmente atractivos e ilustrativos. Ya sea para presentar las tendencias del mercado, los resultados de encuestas o representar estadísticas clave en un formato claro y profesional, estas herramientas desempeñan un papel fundamental para ayudar a la investigación.

2. Tableau Pulse / Power BI AI Visuals: Visualización de datos más inteligente
Qué hace:
Mediante la tecnología de IA, estas plataformas hacen recomendaciones apropiadas sobre qué gráficos utilizar, reconocen patrones y extraen información clave de los conjuntos de datos. Estas herramientas ayudan en la creación de paneles en menos tiempo con mayor claridad, sin socavar la precisión y la relevancia para el negocio.
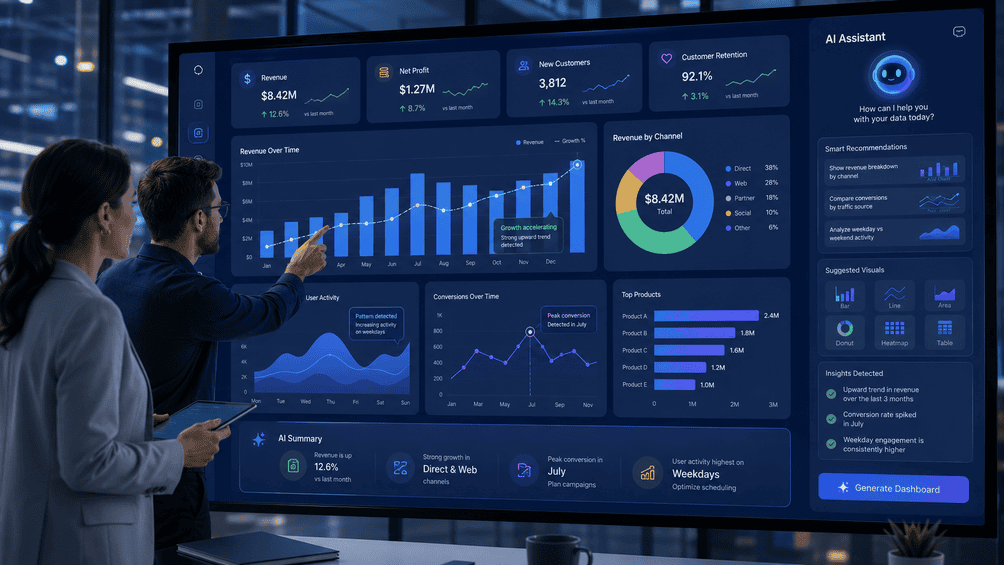
3. Midjourney / DALL·E / Leonardo.ai: Imágenes conceptuales y portadas de informes
Qué hace:
Estas tecnologías generan imágenes, fotografías temáticas y portadas para informes basados en los textos dados. Serán útiles para mejorar el aspecto visual de los trabajos de investigación, especialmente en los casos en que la presentación se utilice para informes de la industria y otros fines de marketing.

4. Napkin.ai / Vizzlo – Visualice marcos y modelos en segundos
Qué hace:
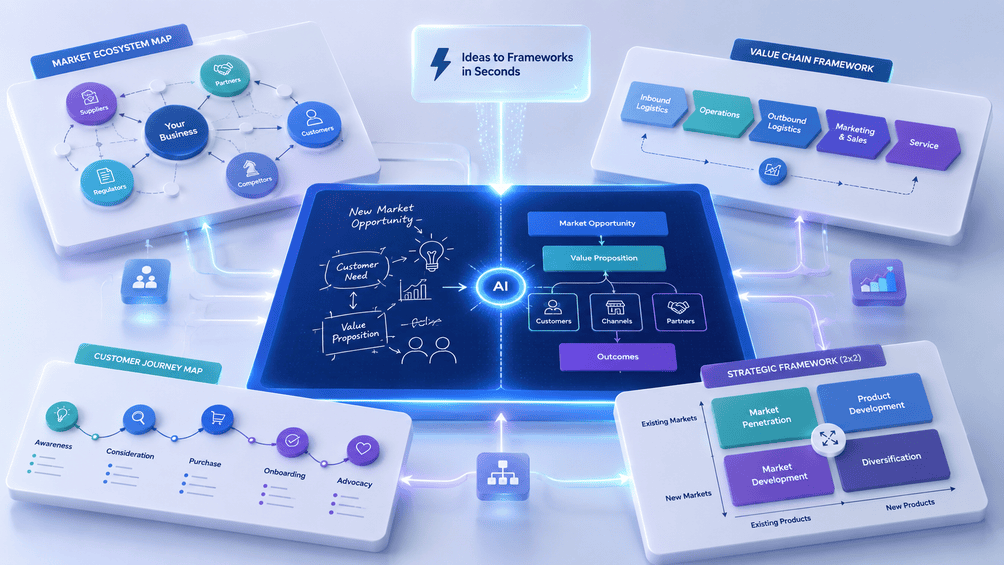
Estas herramientas son propicias para crear diagramas a partir de ideas de negocio, procesos y modelos. En esencia, el ecosistema de mercado, la cadena de valor, el recorrido del cliente y los modelos estratégicos pueden explicarse a través de estos diagramas.
Un nuevo estándar para la narración de historias
Las herramientas para la visualización que utilizan tecnologías de IA están revolucionando el proceso de comunicación en la investigación científica al facilitar la generación de visualizaciones como gráficos, paneles, infografías y diagramas conceptuales.
La mayor ventaja de estas herramientas es la simplificación de conjuntos complicados de datos y los resultados de estudios de investigación en elementos visuales, que son fáciles de entender.
La inteligencia humana es lo que hace posible visualizar conclusiones basadas en datos a través de la tecnología de IA.
Mantente conectado
Síganos para obtener actualizaciones en tiempo real sobre las últimas tendencias basadas en la IA.
Sitio web: UnivDatos
LinkedIn: UnivDatos LinkedIn
Twitter: @UnivDatos
📩 Para consultas, contáctenos en contact@univdatos.com
Próximos eventos y seminarios web
Recibir una llamada
Noticias relacionadas
Suscríbete a nuestros boletines
Al enviar este formulario, entiendo que mis datos serán procesados por Univdatos como se indica arriba y se describe en la Política de Privacidad. *