- Home
- About Us
- Industry
- Services
- Reading
- Contact Us
Power Factor Correction Market: Current Analysis and Forecast (2024-2032)
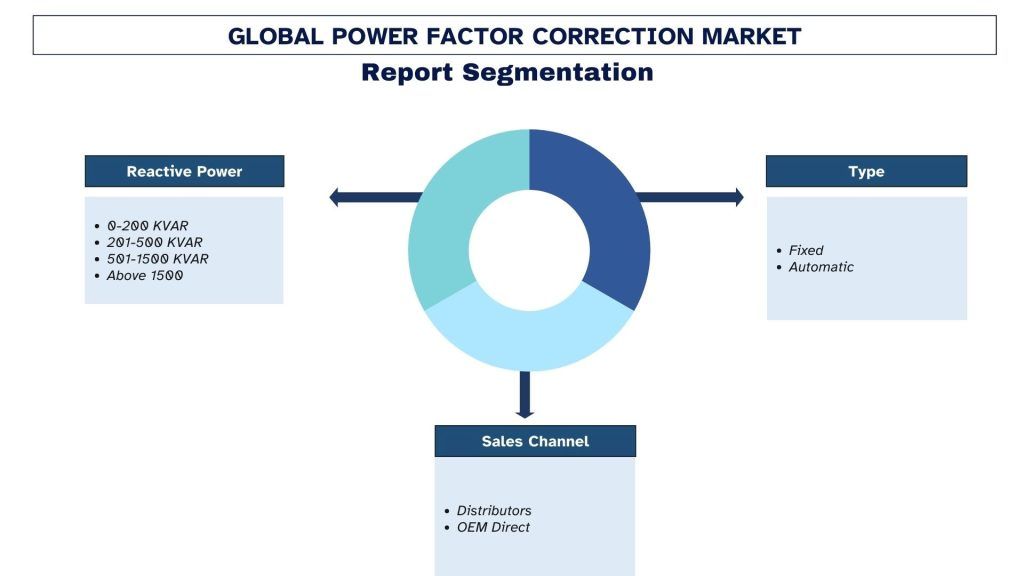
Emphasis on Reactive Power (0-200 KVAR, 200-500 KVAR, 500-1500 KVAR, and Above 1500 KVAR); Type (Fixed and Automatic); Sales Channel (Distributors, and OEM Direct) and Region/Country
Power Factor Correction Market Size & Forecast
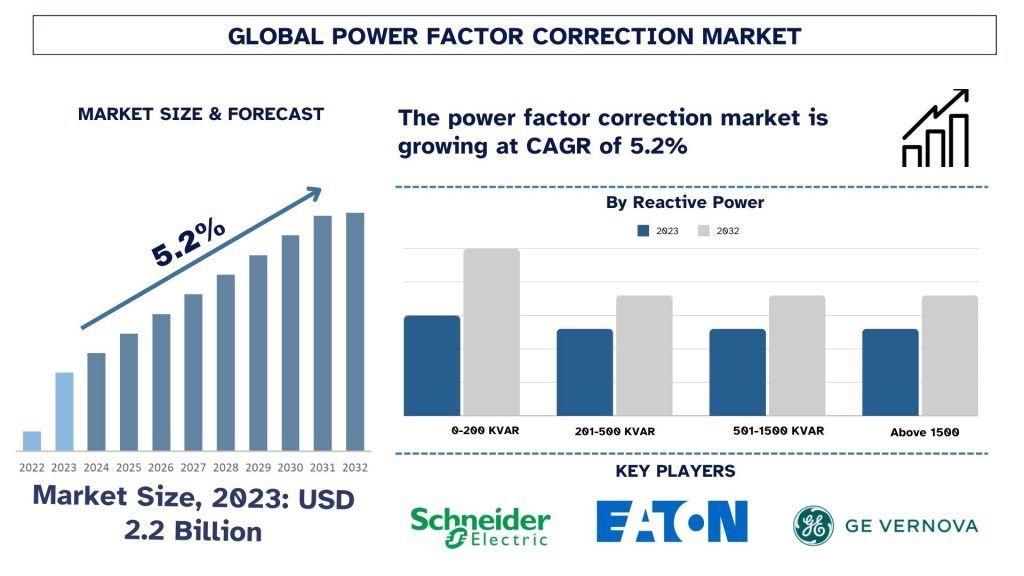
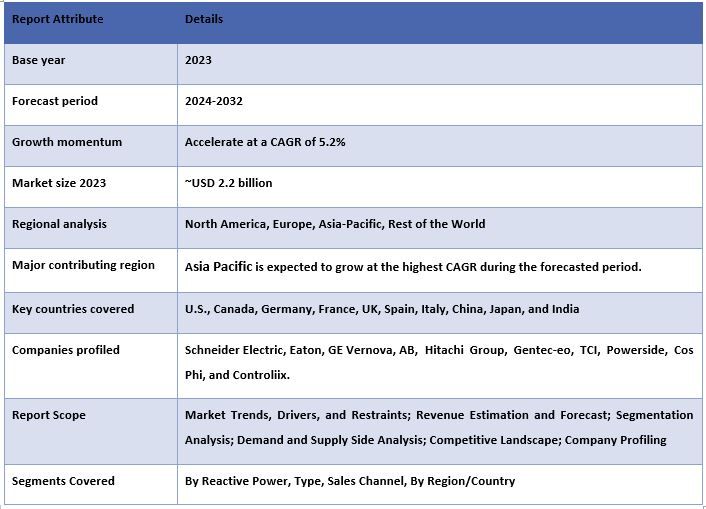
The Power Factor Correction Market was valued at approximately USD 2.2 Billion in 2023 and is expected to grow at a robust CAGR of around 5.2% during the forecast period (2024-2032). The growth of the PFC market is primarily due to the higher demand for energy-efficient techniques and cost reduction in industries and commerce.
Power Factor Correction Market Analysis
Various factors like the enhanced global energy consumption brought about by the advancement of industrialization besides urbanization, are also putting pressure on the power grids. This makes PFC one of the most essential systems for industries since it mainly deals with the optimization of energy and reduction of power loss and the cost of electricity. Moreover, greater regulatory measures on energy effectiveness also depict that due to the increase of global sustainable pressures, companies must use PFC technologies to enrich their energy administration and correspond to the required environmental standards.
The factors that help in the growth of this market is the potential demand for correct power supply from the end user sectors like data centers, manufacturing, and other sectors in the past couple of years the spending on IoT has increased exponentially, the number of lots connected devices and other computer systems also have increased. The projected spending on lots by the end of 2024 is expected to reach around USD 1 Trillion. Moreover, in the year 2021, the spending on IT data centers was estimated to be close to USD 240 Billion.
Power Factor Correction Market Trends
This section discusses the key market trends influencing the power factor correction market segments as identified by our research experts.
0-200 KVAR Type Transforming Industry
The 0-200 KVAR segment accounted for the largest share of the market because this type can be generally applied to practically any low-medium voltage industrial, commercial, and household applications. Specifically, these are the facilities that have lower to midterm power requirements ranges and may be ideal for the firms to adapt towards their increased energy efficiency levels without having to undergo fundamental changes in such setup. Furthermore, for the PFC systems within this range, there will be a steady demand thanks to conjunction facts regarding the cost of energy-cutting and corresponding stipulations in raising concern with the industries for efficient energy in systems.
Asia Pacific is Expected to Grow with Significant CAGR During Forecast Period
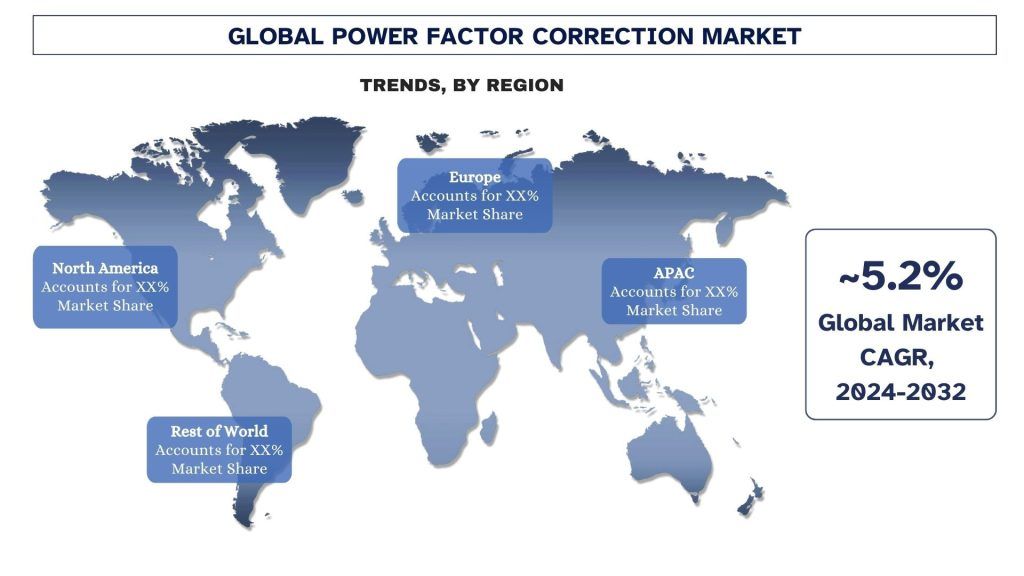
Asia Pacific is expected to grow with a significant CAGR during the forecast period. Fast-growing industrialization and urbanization in countries like China, India Southeast Asia, and other Asian countries puts higher demand for energy consumption and therefore a need for efficient energy management solutions. Thus, practices such as government incentives encouraging advanced energy efficiency and certified low-carbon products in the region are also factors contributing to the adoption of PFC systems. Further, the advancement of the infrastructure and investment in grid modernization is also creating opportunities for the PFC technologies market growth in the Asia Pacific region which will let it lead the overall market growth.
Power Factor Correction Industry Overview
The power factor correction market is competitive, with several global and international market players. The key players are adopting different growth strategies to enhance their market presence, such as partnerships, agreements, collaborations, new product launches, geographical expansions, and mergers and acquisitions. Some of the major players operating in the market are Schneider Electric, Eaton, GE Vernova, AB, Hitachi Group, Gentec-eo, TCI, Powerside, Cos Phi, and Controliix.
Power Factor Correction Market News
For instance, in 2024, Hillcrest Energy Technologies (CSE: HEAT) (OTCQB: HLRTF) (FSE: 7HI), a leader in clean technology and power conversion solutions, proudly announces the launch of a testing and demonstration program for its latest Zero Voltage Switching (ZVS) technology application. This initiative showcases a prototype designed to highlight the value of Hillcrest’s ZVS technology in power factor correction.
In 2024, PowerLogic PFC (previously known as VarSet), the low voltage power factor correction solution from Schneider Electric, expands its best-in-class low voltage capacitor bank with robust, IoT-enabled communication capabilities to provide yet another element within the EcoStruxure™ Power architecture. These new proficiencies provide new opportunities for today’s power systems and energy management applications.
Power Factor Correction Market Report Coverage
Reasons to buy this report:
- The study includes market sizing and forecasting analysis validated by authenticated key industry experts.
- The report presents a quick review of overall industry performance at one glance.
- The report covers an in-depth analysis of prominent industry peers with a primary focus on key business financials, product portfolios, expansion strategies, and recent developments.
- Detailed examination of drivers, restraints, key trends, and opportunities prevailing in the industry.
- The study comprehensively covers the market across different segments.
- Deep dive regional level analysis of the industry.
Customization Options:
The global power factor correction market can further be customized as per the requirement or any other market segment. Besides this, UMI understands that you may have your own business needs; hence, feel free to connect with us to get a report that completely suits your requirements.
Table of Content
Research Methodology for the Power Factor Correction Market Analysis (2022-2032)
Analyzing the historical market, estimating the current market, and forecasting the future market of the global Power Factor Correction market were the three major steps undertaken to create and analyze the adoption of Power Factor Correction in major regions globally. Exhaustive secondary research was conducted to collect the historical market numbers and estimate the current market size. Secondly, numerous findings and assumptions were taken into consideration to validate these insights. Moreover, exhaustive primary interviews were also conducted, with industry experts across the value chain of the global Power Factor Correction market. Post assumption and validation of market numbers through primary interviews, we employed a top-down/bottom-up approach to forecasting the complete market size. Thereafter, market breakdown and data triangulation methods were adopted to estimate and analyze the market size of segments and sub-segments of the industry. Detailed methodology is explained below:
Analysis of Historical Market Size
Step 1: In-Depth Study of Secondary Sources:
A detailed secondary study was conducted to obtain the historical market size of the Power Factor Correction market through company internal sources such as annual reports & financial statements, performance presentations, press releases, etc., and external sources including journals, news & articles, government publications, competitor publications, sector reports, third-party database, and other credible publications.
Step 2: Market Segmentation:
After obtaining the historical market size of the power factor correction market, we conducted a detailed secondary analysis to gather historical market insights and share for different segments & sub-segments for major regions. Major segments are included in the report, such as reactive power, type, sales channel, and regions. Further country-level analyses were conducted to evaluate the overall adoption of testing models in that region.
Step 3: Factor Analysis:
After acquiring the historical market size of different segments and sub-segments, we conducted a detailed factor analysis to estimate the current market size of the Power Factor Correction market. Further, we conducted factor analysis using dependent and independent variables such as reactive power, type, sales channel, and power factor correction market regions. A thorough analysis was conducted of demand and supply-side scenarios considering top partnerships, mergers and acquisitions, business expansion, and product launches in the Power Factor Correction market sector across the globe.
Current Market Size Estimate & Forecast
Current Market Sizing: Based on actionable insights from the above three steps, we arrived at the current market size, key players in the global Power Factor Correction market, and market shares of the segments. All the required percentage shares split, and market breakdowns were determined using the above-mentioned secondary approach and were verified through primary interviews.
Estimation & Forecasting: For market estimation and forecast, weights were assigned to different factors including drivers & trends, restraints, and opportunities available for the stakeholders. After analyzing these factors, relevant forecasting techniques i.e., the top-down/bottom-up approach were applied to arrive at the market forecast for 2032 for different segments and sub-segments across the major markets globally. The research methodology adopted to estimate the market size encompasses:
- The industry’s market size, in terms of revenue (USD) and the adoption rate of the power factor correction market across the major markets domestically
- All percentage shares, splits, and breakdowns of market segments and sub-segments
- Key players in the global power factor correction market in terms of products offered. Also, the growth strategies adopted by these players to compete in the fast-growing market
Market Size and Share Validation
Primary Research: In-depth interviews were conducted with the Key Opinion Leaders (KOLs), including Top Level Executives (CXO/VPs, Sales Head, Marketing Head, Operational Head, Regional Head, Country Head, etc.) across major regions. Primary research findings were then summarized, and statistical analysis was performed to prove the stated hypothesis. Inputs from primary research were consolidated with secondary findings, hence turning information into actionable insights.
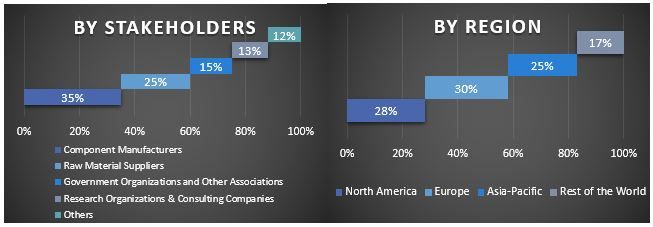
Split of Primary Participants in Different Regions
Market Engineering
The data triangulation technique was employed to complete the overall market estimation and to arrive at precise statistical numbers for each segment and sub-segment of the global power factor correction market. Data was split into several segments and sub-segments after studying various parameters and trends in the reactive power, type, sales channel, and regions of the global Power Factor Correction market.
The main objective of the Global Power Factor Correction Market Study
The current & future market trends of the global power factor correction market were pinpointed in the study. Investors can gain strategic insights to base their discretion for investments on the qualitative and quantitative analysis performed in the study. Current and future market trends determined the overall attractiveness of the market at a regional level, providing a platform for the industrial participant to exploit the untapped market to benefit from a first-mover advantage. Other quantitative goals of the studies include:
- Analyze the current and forecast market size of the Power Factor Correction market in terms of value (USD). Also, analyze the current and forecast market size of different segments and sub-segments.
- Segments in the study include areas of reactive power, type, sales channel, and regions.
- Define and analyze the regulatory framework for the Power Factor Correction
- Analyze the value chain involved with the presence of various intermediaries, along with analyzing customer and competitor behaviors of the industry.
- Analyze the current and forecast market size of the Power Factor Correction market for the major region.
- Major countries of regions studied in the report include Asia Pacific, Europe, North America, and the Rest of the World
- Company profiles of the Power Factor Correction market and the growth strategies adopted by the market players to sustain in the fast-growing market.
- Deep dive regional level analysis of the industry
Frequently Asked Questions FAQs
Q1: What is the global power factor correction market's current size and growth potential?
The Global Power Factor Correction market was valued at USD 2.2 billion in 2023 and is expected to grow at a CAGR of 5.2% during the forecast period (2024-2032).
Q2: What are the driving factors for the growth of the global power factor correction market?
The growth of the PFC market is primarily due to the higher demand for energy-efficient techniques and cost reduction in industries and commerce.
Q3: Which segment has the largest share of the global power factor correction market by reactive power?
The 0-200 KVAR segment has the largest power factor correction market share by reactive power.
Q4: What are the emerging technologies and trends in the global power factor correction market?
Emerging technologies and trends in the global Power Factor Correction market include the integration of IoT-enabled PFC systems, advanced smart grid solutions, and the adoption of automatic power factor correction (APFC) units for enhanced energy management.
Q5: Which region will dominate the global power factor correction market?
North America is expected to dominate the market in 2023.
Related Reports
Customers who bought this item also bought


Wind LiDAR Market: Current Analysis and Forecast (2025-2033)
Emphasis on Product Type (Vertical Profiling Wind LiDAR, Ground-Based Wind LiDAR, Nacelle-Mounted Wind LiDAR, Airborne Wind LiDAR, and Others); Component (Sensor, Navigator, Laser, and Others); Location (Onshore and Offshore); Application (Wind Power, Meteorology & Environment, and Aviation); and Region/Country
April 17, 2026


Tension Leg Platforms (TLP) Market: Current Analysis and Forecast (2025-2033)
Emphasis on Component (Deck Structure, Mooring & Tendon Systems, Risers & Connectors, Control & Safety Systems, and Other Components); Application (Offshore Oil & Gas Production, Offshore Wind Energy Platforms, Deepwater Drilling Support, and Other Offshore Structures); and Region/Country
April 10, 2026