Smarter Decisions. Backed by Intelligence.
UnivDatos helps global organizations make better business decisions through market intelligence, data analytics, and procurement intelligence services designed to bring clarity, strengthen planning, and deliver measurable outcomes.


0+

0+

0+

0+

0+
Trusted by Industry Leaders
Serving 15+ Fortune 500 companies across 100+ countries


What We Provide
We empower global enterprises with actionable intelligence, robust data analytics, and dedicated research support to accelerate strategic decision-making.
Market Intelligence
Comprehensive insights into market dynamics, competitor landscapes, and emerging trends to drive your growth.
- Custom Market Research
- Consumer Insights
- Competitor Intelligence
- Go-to-Market Strategy
Data Analytics Services
Turn complex data into actionable insights through advanced statistical modeling and data engineering.
Procurement Management
Optimize your supply chain, evaluate suppliers, and reduce costs with data-backed procurement strategies.
- Category Intelligence
- Supplier Intelligence
- Cost & Margin Analytics
- Procurement Support
Our latest research
Explore our most recent market insights and in-depth analytical reports spanning across major global industries.


What Our Clients Say About Us
Read stories and feedback from global industry leaders who trust our data, intelligence, and consultation to make strategic business moves.
Featured & Cited in Leading Media
Contemplate and gaze at our reports cited by the inquisitors/specialists of leading media/publishing houses.


How Poor Data Quality Impacts Business Performance
Every important business decision depends on data. Organizations use it to forecast demand, evaluate financial performance, manage suppliers, optimize inventory, understand customers, and monitor operations. When that data is incomplete, outdated, duplicated, or inconsistent, even a well-planned business strategy can produce unreliable results. Data Quality Management is the process of improving and maintaining the accuracy, completeness, consistency, and reliability of business data. It brings together data cleansing, validation, governance, monitoring, and clear ownership so that information can be trusted across reporting, analytics, AI, and everyday operations. Poor data quality is therefore not only a technical concern. It can slow down decisions, increase manual work, weaken customer and supplier management, and reduce confidence in business reporting. The Business Cost of Poor Data Quality Data-quality problems rarely remain limited to one system or department. A duplicate customer record can distort sales reports. An outdated supplier profile can affect sourcing decisions. Inconsistent product classifications can reduce inventory visibility, while incomplete financial data can delay budgeting and performance reviews. Over time, these issues create four major business consequences. Reporting becomes less reliable. Different departments may use different definitions, formats, or source systems for the same KPI. Leadership then spends more time validating numbers than deciding what action to take. Operational efficiency declines. Employees spend hours correcting records, reconciling spreadsheets, investigating exceptions, and repeating work that should have been automated. Customer and supplier decisions become less effective. Weak Customer Data Management can lead to duplicate communications, inaccurate account histories, poor segmentation, and missed opportunities. Inconsistent supplier data can affect negotiations, inventory planning, and operational continuity. Strategic decisions carry greater risk. Forecasting, pricing, resource allocation, investment planning, and performance management are only as reliable as the information supporting them. Data Quality Is a Business Responsibility Many organizations still view data quality as an IT responsibility. In practice, reliable data requires input from across the business. Finance teams understand how transactional data affects reporting. Sales teams understand customer and opportunity records. Procurement teams understand supplier and category information, while operations teams understand products, materials, locations, and processes. Technology teams can apply rules and controls, but business users must define what accurate and useful data means within their functions. This is where Data Governance becomes important. Governance defines who owns the data, which standards should be followed, and how issues should be resolved. Data Quality Management focuses on improving the condition of the data itself. Together, they create a more sustainable approach to Enterprise Data Management. Poor Data Also Weakens Analytics and AI Organizations are investing heavily in automation, Data Analytics Services, Business Intelligence Solutions, and AI-enabled decision-making. However, these technologies depend on the quality of the data they receive. Duplicate records can distort customer or supplier analysis. Missing values can reduce model accuracy. Inconsistent classifications can make comparisons unreliable, while outdated information can produce recommendations that are no longer relevant. AI can help with profiling, anomaly detection, record matching, classification, and exception review. However, it is most effective when supported by clear business rules, analyst oversight, and subject-matter expertise. Before expanding AI or advanced analytics, organizations should first assess whether their data is accurate, complete, consistently structured, and suitable for the intended use. Building an Effective Data Quality Strategy Improving data quality is not a one-time cleanup exercise. New systems, processes, users, and records can introduce fresh errors, so organizations need an approach that fixes current problems and prevents them from returning. Start by identifying the data that matters most. This may include customer, supplier, product, material, financial, and operational records. Review where duplicate entries, missing information, outdated fields, or inconsistent formats are affecting reporting and business processes. Next, assign clear ownership. Business teams should define how important data is created, classified, updated, and used. Governance policies can then establish the standards and accountability needed to maintain consistency. Quality checks should also be built into data entry and system transfers. Required fields, approved formats, value rules, mapping logic, and exception alerts can identify errors before they affect reports, analytics, or downstream applications. Existing records may still require correction. This can include removing duplicates, standardizing formats, matching related entries, completing important fields, and resolving conflicting information. For large or complex datasets, Data Cleansing Services can help complete this work efficiently while preserving the relevant business rules. Where information is spread across ERP, CRM, finance, procurement, cloud platforms, and spreadsheets, Data Integration Services can help create a more consolidated reporting environment. Integration should still be supported by shared definitions, mapping standards, and clear ownership. Finally, data quality should be monitored continuously. Tracking recurring errors, validation failures, duplicate rates, and issue-resolution times allows organizations to strengthen controls over time. This ongoing Data Quality Assurance creates a stronger foundation for reporting, operations, analytics, and AI. How UnivDatos Strengthens Data Quality UnivDatos provides Data Quality Management Services that help organizations improve the accuracy, consistency, completeness, and usability of business data. Our support can include: Data profiling and quality assessment Data cleansing and standardization Duplicate detection and record matching Validation-rule development Cross-system mapping Master-data harmonization Data classification and enrichment Governance and ownership controls Migration-readiness support Quality monitoring and exception management We use AI where it can improve speed and scale, including anomaly detection, matching, classification, rule suggestions, and exception prioritization. These capabilities are combined with analyst review and subject-matter expertise to ensure that decisions reflect business context. The objective is not simply to correct individual records. It is to build a reliable data foundation that supports reporting, analytics, operations, AI, and long-term decision-making. Final Perspective Poor data quality affects much more than databases. It can reduce reporting confidence, increase employee workload, weaken customer experiences, and create risk across strategic and operational decisions. Effective Data Quality Management helps organizations move from repeatedly correcting errors to preventing them through clear ownership, validation, standardization, governance, and continuous monitoring. Reliable data allows leaders to spend less time questioning information and more time acting on it with confidence. Explore UnivDatos’ Data Quality Management Services to identify which data should be assessed, cleaned, standardized, validated, mapped, or governed first. Frequently Asked Questions How can a company tell if poor data quality is affecting performance? Common warning signs include conflicting reports, duplicate customer or supplier records, frequent spreadsheet corrections, inaccurate forecasts, inconsistent classifications, and excessive time spent reconciling information. Should a business begin with data cleansing or data governance? Immediate reporting or migration issues may require cleansing first. However, cleansing without ownership and controls allows the same problems to return. In most cases, Data Cleansing and Data Governance should progress together. Can Data Quality Management Software solve every data issue? Data Quality Management Software can automate profiling, validation, matching, and monitoring. However, business-specific classifications, acceptable exceptions, and conflicting system rules often require human review and domain expertise. How does poor data quality affect system migrations? Migrating inaccurate or duplicated records transfers existing problems into the new environment. Pre-migration Data Validation, cleansing, matching, and standardization reduce implementation risk and improve the usability of the migrated data. When should a company use external Data Quality Management Services? External support is useful when data volumes are large, multiple systems need to be reconciled, internal teams lack capacity, or the work requires specialist validation, classification, or domain expertise. How does UnivDatos combine AI with human validation? UnivDatos uses AI-assisted techniques for profiling, anomaly detection, record matching, classification, and exception prioritization. Analysts and subject-matter experts review complex cases to ensure that the final decisions reflect business rules and operational context.

How Business Intelligence Services Improve Decision-Making Across the Organization
Most organizations do not have a shortage of data. They have difficulty converting that data into timely, reliable decisions. Business Intelligence Services combine data integration, analytics, reporting, dashboard development, and strategic advisory support to transform information from multiple business systems into consistent, decision-ready insights. When finance, sales, operations, procurement, and marketing rely on different systems and KPI definitions, leadership receives a fragmented view of performance. The result is slower decision-making, conflicting reports, and management discussions focused on validating numbers rather than determining the right course of action. By connecting data, standardizing KPIs, and improving reporting visibility, Business Intelligence Services help leaders understand what is changing, why it is changing, and where action is required. The Real Value of Business Intelligence The value of business intelligence is not the number of dashboards an organization creates. It is the quality and speed of the decisions those dashboards support. Effective Business Intelligence Services help leaders answer four questions: What is changing? Why is it changing? Where should management focus? What action should be taken? This requires more than technology. It requires clear KPI definitions, reliable data, relevant reporting, and a strong understanding of how decisions are made across the organization. That is why business intelligence consulting should begin with business priorities rather than software selection. The starting point is not, “Which dashboard should we build?” It is, “Which decision should this dashboard improve?” Why Traditional Reporting Falls Short Traditional reporting is designed primarily to explain what happened. Modern organizations need to understand what is happening now, why it is happening, and what may require intervention. Static reports often create three problems. First, they are slow. Analysts may spend hours extracting data, updating spreadsheets, reconciling figures, and preparing management presentations. Second, they are fragmented. Finance, sales, procurement, and operations may use different systems and different definitions of the same KPI. Third, they are descriptive rather than diagnostic. A report may show that profitability has declined without explaining whether the cause is pricing, supplier costs, product mix, inventory, capacity utilization, or customer demand. Business intelligence analytics addresses these limitations by allowing users to move from headline metrics to the underlying drivers of performance. A margin decline can be examined by product, region, customer, supplier, channel, or business unit. This shifts management conversations from debating the numbers to deciding what to do about them. How Business Intelligence Improves Decision-Making The first benefit is alignment. Business Intelligence Services create a common reporting environment in which teams work from consistent data and standardized KPIs. This reduces the risk of departments presenting conflicting versions of performance. The second benefit is speed. BI implementation services can automate data preparation, calculations, report refreshes, and distribution. Leadership gains faster access to information, while analysts spend less time assembling reports and more time interpreting them. The third benefit is visibility. Well-designed dashboards allow users to identify exceptions, compare performance, and investigate root causes. Executives can monitor overall performance, while functional leaders can access the detail required to manage customers, suppliers, products, teams, or processes. The fourth benefit is earlier intervention. Business intelligence can reveal developing issues such as declining customer retention, rising inventory, increasing supplier dependency, reduced sales conversion, recurring delivery delays, or gaps between forecasts and actual results. The fifth benefit is stronger collaboration. Many business problems cut across functions. A profitability issue may involve sales pricing, procurement costs, operational efficiency, and customer demand. When teams work from the same metrics, discussions become more focused on coordinated action. Business Intelligence Across Key Functions Finance teams can use BI to monitor revenue, margin, costs, working capital, budgets, and performance against forecasts. Sales leaders can compare conversion, pipeline quality, customer performance, and regional growth. Procurement teams can assess spend, supplier performance, category exposure, and delivery risk. Operations teams can monitor productivity, utilization, capacity, and process delays. Marketing teams can evaluate acquisition costs, campaign effectiveness, and channel performance. Executive leadership can use consolidated scorecards to identify where intervention or investment is required. The most effective BI environments do not provide every user with the same dashboard. They provide each user with the information required for their role while maintaining consistent underlying data. Building a BI Strategy That Delivers Value A strong BI strategy begins with the decisions that matter most. Organizations should first identify where decision-making is currently delayed, which reports lack trust, where manual effort is highest, and which KPIs create disagreement. The existing reporting environment should then be assessed for duplicate reports, inconsistent calculations, unused dashboards, data-quality issues, and performance limitations. Use cases should be prioritized according to business impact, data availability, reporting frequency, number of users, and implementation complexity. This prevents organizations from investing in dashboards that look impressive but provide limited decision value. Technology should support this strategy rather than define it. Platforms such as Power BI, Tableau, Looker, and AWS Quick Sight can all provide value when aligned with the organization’s data environment and reporting needs. Power BI services may include data modelling, KPI development, reporting automation, executive scorecards, Power BI dashboard development, migration, optimization, and ongoing support. Organizations with an established Tableau environment may require Tableau development services for dashboard creation, redesign, migration, visualization improvement, or performance optimization. A capable business intelligence service provider should also address adoption. A technically accurate dashboard creates limited value if users do not trust it, understand it, or use it consistently. How UnivDatos Supports Better Decision-Making At UnivDatos, we believe business intelligence should improve management decisions, not simply increase reporting volume. Our Business Intelligence Services help organizations align KPIs, reduce manual reporting effort, improve dashboard usability, and create reporting environments that support practical business needs. Our support can include BI roadmap development, reporting requirements assessment, KPI standardization, platform implementation, data-model configuration, dashboard development, executive scorecards, functional reporting, migration, optimization, and ongoing BI support. As a business intelligence service provider, we work across platforms including Power BI, Tableau, Looker, and AWS Quick Sight. Our focus is on making reporting accurate, relevant, scalable, and easy for business users to interpret. Final Perspective Organizations rarely struggle because they lack information. They struggle because information is fragmented, inconsistent, delayed, or disconnected from the decisions leaders need to make. Business Intelligence Services help close this gap by creating a shared view of performance, improving reporting speed, and making the drivers of business outcomes more visible. The ultimate measure of BI success is not dashboard adoption alone. It is whether leaders can identify what is changing, understand why it is changing, and act with greater confidence. Explore UnivDatos’ Business Intelligence Services to strengthen reporting, KPI visibility, and decision-making across your organization. Frequently Asked Questions 1. What are Business Intelligence Services? Business Intelligence Services help organizations turn data from multiple systems into standardized KPIs, dashboards, reports, and decision-ready insights. 2. What does business intelligence consulting involve? Business intelligence consulting helps organizations define BI priorities, align KPIs, assess reporting gaps, select use cases, and design an implementation roadmap. 3. What do BI implementation services include? BI implementation services may include platform setup, data modelling, KPI development, dashboard creation, testing, deployment, migration, and user support. 4. What are Power BI services? Power BI services may include dashboard development, reporting automation, data modelling, implementation, migration, optimization, and ongoing maintenance. 5. How can UnivDatos help? UnivDatos provides business intelligence consulting, BI implementation services, Power BI dashboard development, Tableau development services, reporting optimization, and ongoing BI support.

How Data Engineering Services Accelerate Business Growth
Most businesses do not struggle because they lack data. The real challenge is making that data accessible, reliable, and useful. Sales teams work with CRM reports, finance teams rely on ERP data, operations teams monitor separate dashboards, and marketing teams track customer activity through digital platforms. Each function generates valuable information, but these systems often operate independently. As a result, teams spend hours combining spreadsheets, checking figures, and resolving differences between reports. Decisions take longer, opportunities are missed, and leaders are often left questioning which numbers they can trust. This is where data engineering services create measurable business value. They help organizations connect information across systems, improve data quality, and prepare data for reporting, analytics, automation, and artificial intelligence. As businesses grow and their data requirements become more complex, a reliable data foundation allows them to make faster decisions, improve efficiency, and scale with greater confidence. What Are Data Engineering Services? Data engineering services focus on building the infrastructure that enables organizations to collect, integrate, transform, store, and manage enterprise data efficiently. Rather than simply moving information between systems, they ensure data is accurate, consistent, secure, and accessible whenever it’s needed. For example, an organization may have customer information in a CRM platform, financial records in an ERP system, operational data in internal applications, and market information from external sources. Data engineering brings these sources together and prepares the information for dashboards, business intelligence tools, forecasting models, and AI applications. This may involve building automated pipelines, standardizing formats, removing duplicate records, applying validation rules, and creating a central environment where teams can access trusted information. Without this foundation, even advanced dashboards and AI models can produce incomplete or inconsistent results. Even the most advanced technology can deliver inconsistent results when the underlying data is incomplete, fragmented, or poorly structured. Common Business Challenges and How Data Engineering Services Help The Business Impact of Data Engineering Reliable data improves much more than reporting. It allows leaders to compare performance across departments, identify changes earlier, and make decisions with greater confidence. Instead of waiting for teams to manually prepare information, decision-makers can access timely insights and respond more quickly to changes in customer behaviour, operational performance, or market conditions. Automation also allows employees to focus on higher-value work. When routine data preparation is handled through automated workflows, analysts and business teams can spend more time interpreting results, investigating performance gaps, and identifying opportunities. Connected information also improves visibility across functions, helping organizations understand how customers, products, suppliers, finances, and operations affect one another. A strong data foundation is particularly important for businesses investing in AI and advanced analytics . AI models require accurate, structured, and accessible information. If the underlying data is incomplete or inconsistent, the results will be unreliable regardless of how advanced the technology may be. Data engineering prepares enterprise information for these applications and increases the likelihood that analytics and AI initiatives will deliver meaningful outcomes. Why Choose UnivDatos for Data Engineering Services? Building a reliable data environment requires technical expertise as well as an understanding of business priorities. At UnivDatos, we begin by assessing how data is currently collected, managed, and used across the organization. This helps us identify the gaps affecting reporting, operational efficiency, data quality, or decision-making. Our data engineering consulting services are designed around practical business requirements. Depending on the organization’s needs, this may include connecting disconnected systems, automating data pipelines, improving data quality, transforming raw information, or preparing trusted datasets for analytics and AI. We focus on building solutions that work with the organization’s existing processes and support its long-term objectives. The goal is not simply to introduce new technology. It is to make data easier to access, easier to trust, and more valuable to the business. Whether an organization wants to modernize reporting, reduce manual work, improve data quality, or prepare for advanced analytics, UnivDatos helps build the foundation required for sustainable growth. Connect with our experts to explore how our data engineering services can support your business and digital transformation priorities. Frequently Asked Questions 1. What are data engineering services? Data engineering services involve designing, building, and managing the infrastructure that collects, integrates, transforms, and stores enterprise data. They ensure information is accurate, secure, and readily available for analytics, reporting, and business decision-making. 2. Why are data engineering services important for business growth? They help organizations reduce manual reporting, improve data quality, connect information across departments and provide reliable insights for faster and more informed decisions. 3. How do data engineering services support AI initiatives? AI systems rely on high-quality, well-structured data. Data engineering services prepare and manage enterprise data, making it suitable for machine learning, predictive analytics, and other AI-driven applications. 4. What is data pipeline development? Data pipeline development is the process of designing automated workflows that collect, process, transform, and deliver data from multiple sources. It helps organizations reduce manual effort while improving the speed and accuracy of reporting. 5. Which industries benefit from data engineering services? Industries such as healthcare, BFSI, retail, manufacturing, logistics, telecommunications, and energy benefit from data engineering services by improving operational efficiency, enhancing customer experiences, and supporting data-driven decision-making. 6. How can UnivDatos help with data engineering services? UnivDatos offers data engineering services, including data integration services, data transformation services, modern data architecture, and analytics enablement. We work closely with organizations to build scalable data ecosystems that support long-term business growth and digital transformation.

Global 25G Optical Module Market Seen Soaring 13.02% Growth to Reach USD million by 2034, Projects UnivDatos.
Key Highlights of the Report : The rapid expansion of 5G networks, hyperscale data centers, and cloud-native workloads is accelerating demand for 25G optical modules, as network operators and enterprises require faster, lower-latency, and more cost-efficient optical interconnect solutions across telecom and data infrastructure. The market is benefiting from the growing shift from 10G to 25G Ethernet architectures, since 25G offers a more favorable balance of bandwidth, port density, and cost per bit for modern switching and server connectivity environments. The increasing requirement for high-speed, scalable, and energy-conscious connectivity is further supporting the adoption of 25G optical modules, particularly in environments where operators must manage rising traffic volumes without a proportional increase in power and infrastructure costs. Data Centers held a significant market share in 2025 due to strong demand for high-density interconnects, cloud expansion, AI workload growth, and the need for efficient east-west traffic handling, while Telecommunications is expected to witness the fastest growth due to accelerating 5G rollout and ongoing transport network modernization SFP28 accounted for a significant share in 2025 owing to its compact form factor, lower power usage, and cost-effective migration path from legacy 10G systems, while QSFP28 is expected to grow strongly due to increasing adoption in higher-bandwidth aggregation and hyperscale data center applications. Industry participants are increasingly prioritizing higher port density, lower power consumption, better thermal efficiency, and standards-based interoperability, which is further contributing to product refinement and broader deployment across telecom, cloud, and enterprise environments. Asia-Pacific, however, is emerging as the fastest-growing region owing to rapid 5G expansion, rising cloud and AI infrastructure investment, and accelerating digital infrastructure development. Ericsson says Southeast Asia and Oceania alone are forecast to reach around 620 million 5G subscriptions by the end of 2028. According to a new report by UnivDatos, The Global 25G Optical Module Market is expected to reach USD million in 2034 by growing at a CAGR of 13.02%. The global 25G optical module market is becoming very active due to the rapid growth of 5G networks, hyperscale data centers, and cloud-based digital infrastructure, and the increasing demand for higher-bandwidth, lower-cost optical connectivity. Optical modules with 25G are becoming a realistic upgrade to outdated 10G systems due to being faster, having higher port density, and costing less per bit to operate as a modern telecom and data center solution. The 25G modules are on the rise, as businesses, cloud service providers, and telecommunications companies are looking into scalable interconnection solutions to manage increased traffic volumes, AI workloads, and latency-sensitive applications. There is also a shift in the market, as traditional network upgrades are giving way to broader infrastructure modernization, as reflected in recent developments. In June 2025, Huawei claimed that over 240 networks had been upgraded to 400G worldwide, indicating an increasing pace of upgrades in optical transport infrastructure. These developments are indicative of the overall industry driving toward higher capacity and more efficient optical connectivity, which also facilitates demand creation in the immediately adjacent 25G deployment space. Access sample report (including graphs, charts, and figures): https://univdatos.com/reports/25g-optical-module-market?popup=report-enquiry Expansion of 5G Network Infrastructure The 5G network infrastructure is rapidly developing, which is one of the most prominent forces driving the 25G optical module market. As the world telecom operators have put velocity in their 5G networks, there has been a growing demand of high speed low latency and reliable communications systems. Optical modules of 25G are necessary to facilitate such features, as they allow a high-capacity data transmission in 5G front-haul and back-haul networks. Such modules offer the bandwidth and performance needed to support the growing volume of data traffic generated by advanced applications involving IoT, autonomous vehicles, augmented reality, and smart city solutions. Unlike the past generations of mobile networks, 5G requires a denser, more extensive network structure, which necessitates the research and development of high-performance optical connectivity solutions. Super modules such as 25G modules are specifically designed to suit these environments because they provide a compromise in terms of speeds, cost, and power consumption. These modules are becoming more popular among telecom operators aiming to increase network capacity, reduce latency, and improve the overall quality of the service they offer. For example, in 2025, Huawei Technologies Co., Ltd. extended its 5G optical transport offerings to enable large-scale network deployments. These resolutions helped in faster data delivery, reliability in the networks, as well as scalability, which proved that 25G optical modules are essential in next-generation telecom infrastructure. Thus, 5G market expansion is being driven by its worldwide adoption . According to the report, the Asia-Pacific region grows with the highest CAGR in the 25G Optical Module Market The Asia Pacific region is expected to grow with a significant CAGR during the forecast period (2026-2034). This expansion is largely driven by the strong growth of 5G infrastructure, increased adoption of cloud computing, hyperscale and AI investment in data centers, larger fiber connectivity information, and growing enterprise need to connect speedy digital connections within nations like China, India, Japan, Taiwan, and Southeast Asia. Trends in the region are favorable towards the telecom operators shifting transport networks and cloud vendors developing local infrastructure to handle workloads in AI, in real-time applications, and the increasingly high data traffic. Moreover, programs on the digital economy supported by the government, and further investment in the national cloud zones, are establishing positive preconditions for the introduction of 25G optical modules into telecom and data center systems. For example, in June 2025, AWS reported that the AWS Asia Pacific (Taipei) Region was launched with three Availability Zones, indicating rapid cloud infrastructure growth in the area and supporting the long-term need for an optical interconnect solution. Key Offerings of the Report Market Size, Trends, & Forecast by Revenue | 2026−2034. Market Dynamics – Leading Trends, Growth Drivers, Restraints, and Investment Opportunities Market Segmentation – A detailed analysis By Product Type, By Application, By End-User, and By Region Competitive Landscape – Top Key Vendors and Other Prominent Vendors

From Research To Results: Ai Tools For Smarter Knowledge Extraction
MAY 2026 Turning Information into Actionable Insights In today’s situation, research cannot be restricted to information gathering alone; the speed, accuracy, and relevance of the research findings also become very important in making business decisions. AI-based systems are helping analysts in streamlining secondary and primary research activities by extracting knowledge, preparing summaries, automating repetitive processes, and facilitating structured analyses. They are saving time and enhancing efficiency in research. Human expertise still becomes necessary in verifying sources, ensuring accuracy, interpreting context, and converting AI-derived results into insightful knowledge. 1. BrowseGPT / Perplexity.ai / Scite.ai: Intelligent Research and Citation Retrieval What It Does: These tools assist analysts in finding relevant information, retrieving credible sources, and supporting citation-based research. They help make secondary research faster and more structured, while human review ensures source reliability and contextual relevance. 2. Glasp / ScholarAI / Elicit: Summarizing Papers and Reports What It Does: These tools help summarize academic papers, reports, articles, and other research documents. They support quick understanding of key findings, methodologies, and research gaps, while analysts ensure correct interpretation and meaningful use of the insights with manual intervention. 3. CompanyLens / AutoLens: Company Profiling and Forecasting What It Does: These custom AI frameworks support company profiling, competitive tracking, and forecasting-related research. They help organize company-level information and generate structured insights, while analyst expertise remains important for validation and market interpretation. 4. Zapier / Make: Automating Repetitive Research Tasks What It Does: These platforms help automate routine tasks such as data collection, CRM updates, alerts, and workflow management. They reduce manual effort and improve productivity, while proper monitoring is needed to ensure accuracy and smooth execution required for analyst support. A New Standard for Storytelling AI tools are improving the way analysts collect, summarize, and organize research information. These tools help reduce repetitive work and speed up knowledge extraction. The greatest advantage lies in supporting faster and more structured research processes. Human intelligence remains essential for validation, context, and meaningful insight generation. Stay Connected Follow us for real-time updates on the latest AI-based trends. Website: UnivDatos LinkedIn: UnivDatos LinkedIn Twitter: @UnivDatos 📩 For inquiries, reach out to us at contact@univdatos.com Upcoming Events & Webinars

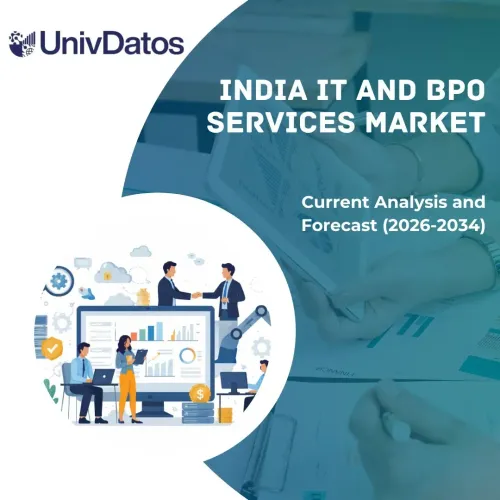
India IT and BPO Services Market Seen Soaring ~11.49% Growth to Reach USD Million by 2034, Projects UnivDatos.
Key Highlights of the Report : The market of India's IT and BPO services has a high growth momentum due to the growing need for global outsourcing, accelerating digitalization, and the growing use of AI, cloud, and automation technologies, which makes the country a strategic global delivery model. In terms of the competitive landscape, the market is highly consolidated, with the major players reinforcing their market standing through service diversification, digitalization, and long-term customer contracts, while middle-tier firms specialize in niche and high-value services. In the region, South India remains dominant with its developed IT ecosystem and talent pool, whereas North India is a high-growth region, backed by developing infrastructure, new GCC formations, and growing enterprise investments. IT services dominate the market in terms of segmental performance, with the fastest growth in Engineering and R&D and advanced BPM services, which are characterized by innovation-driven demand and growing complexity of outsourced functions. The market is being redefined by strategic alliances, mergers, and acquisitions, and by increased investment in Global Capability Centers (GCCs), AI, and digital engineering, which enable companies to expand global delivery capacity and shift to high-value, outcome-based service models. According to a new report by UnivDatos, the India IT and BPO Services Market is expected to reach USD Million in 2034 by growing at a CAGR of 11.49% during the forecast period (2026-2034F). The market is mainly driven by global demand for cost optimization and operational efficiency, backed by India's large pool of skilled IT personnel. The demand for outsourcing is growing rapidly due to the rapid digital transformation of industries, such as cloud use, integration of AI, and making decisions based on data. Also, the ecosystem is further reinforced by positive government policies, growing digital infrastructure, and robust export potential. Moreover, the shift from conventional outsourcing to platform-based and knowledge-based services is generating higher-value prospects, and the rate is accelerating. Driver: Government Support & Policy Initiatives Policy initiatives and government support are major drivers of growth in the Indian IT and BPO services market by establishing a favorable business and regulatory environment. Digital India, Startup India, and IT export promotion programs are driving rapid digitalization and competitiveness in the industry. The presence of supportive policies in the areas of SEZs, data centers, and IT infrastructure development is attracting both local and foreign investment. Also, the regulatory environment, such as data protection policies, is strengthening trust and facilitating safe outsourcing activities. The ongoing investment in digital infrastructure and skills enhances the industry's scalability and long-term growth. For example, on March 25, 2026, as per the Ministry of Electronics & IT, the Government of India launched the IndiaAI mission with an outlay of INR 10,372 crore (~USD 1,120 million) for the development of the overall AI ecosystem in the country. With India’s push to democratise Artificial Intelligence and expand compute capacity, along with the rapid growth of data centers and cloud infrastructure, there has been a corresponding increase in demand for high-performance compute resources, including Graphics Processing Units (GPUs). A total of 190 projects have been approved under the IndiaAI Mission. Out of these 78 projects, 46 are with Startups & MSMEs, 30 are with early-stage startups, 27 are with Researchers or academia, 5 are with students, and 4 are with early-stage researchers. Access sample report (including graphs, charts, and figures): https://univdatos.com/reports/india-it-and-bpo-services-market?popup=report-enquiry According to the report, the impact of India IT and BPO Services has been identified to be high in the North India area. Some of how this impact has been felt include: North India is expected to grow with a significant CAGR during the forecast period (2026-2034). This is mainly due to the rapid digital transformation in tech hubs across the region, such as Noida, Gurugram, and Delhi-NCR. The growing number of Global Capability Centers and increased investment in office infrastructure are attracting domestic and foreign companies. Also, this region has strategic strengths, including closeness to government facilities, enhanced connectivity, and the increasing skilled workforce. Moreover, companies are increasingly establishing a presence here to spread geographic risk and reduce reliance on conventional hubs. Additionally, favorable state policies and cost benefits relative to oversaturated markets in the south are driving adoption. For example, on April 3, 2026, Nimbus BPO announced the inauguration of its new branch in Sector 63, Noida, marking a key milestone in the company's ongoing expansion and growth strategy. In addition to expanding its operational footprint, Nimbus BPO plans to leverage the new branch as a hub for innovation. The company intends to develop capabilities in emerging technologies, including Artificial Intelligence and other next-generation solutions, to enhance its service offerings. Key Offerings of the Report Market Size, Trends, & Forecast by Revenue | 2026−2034. Market Dynamics – Leading Trends, Growth Drivers, Restraints, and Investment Opportunities Market Segmentation – A detailed analysis By Service Type, By Outsourcing Type, By Organization Size, By End-User Industry, By Region Competitive Landscape – Top Key Vendors and Other Prominent Vendors