Enhanced Water Market: Current Analysis and Forecast (2022-2028)
Emphasis on Water Type (Nutrient Enhanced, Electrolyte Enhanced, Alkaline Enhanced, and Oxygenated Enhanced); Distribution Channel (Offline and Online); End-User (Residential and Commercial); and Region/Country
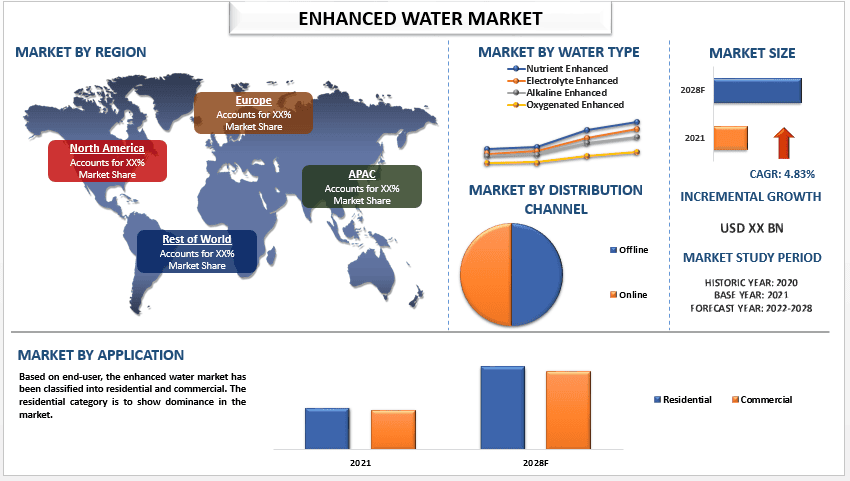
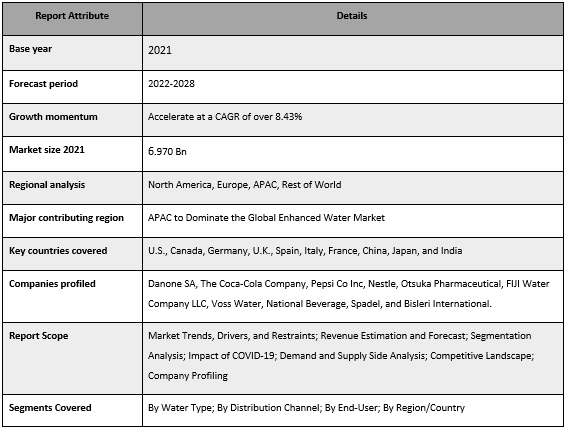
Global Enhanced Water Market is expected to grow at a significant rate of around 4.83% during the forecast period. Enhanced Water is a safe, healthy, and conveniently packaged food product that is now being widely consumed by a large number of people across the globe. As Enhanced Water refers to bottled water that has been infused or fortified with additional nutrients, vitamins, or minerals. These may include ingredients such as electrolytes, antioxidants, or vitamins like vitamin C or B12. Many major players are launching newly enhanced water products in the market. For instance, in Aug 2021, Evian launched enhanced sparkling water called Evian+ to combat energy slumps. The drink is enhanced with magnesium and zinc to help contribute to normal cognitive function and comes in four flavors. Also, Evian+ comes in aluminum cans to encourage recycling and to alleviate the continued pressure exerted by consumers surrounding the use of plastic. Factors such as increasing prevalence by consumers to aid stress. For instance, in Sep 2020, PepsiCo launched enhanced water to aid sleep as consumers struggle with stress. Furthermore, the consumption of Enhanced Water is increasing as the consumption of healthy hydration as well as soothing thirst-quenching drinks. As people are becoming aware of the detrimental effects on health due to dehydration.
Danone SA, The Coca-Cola Company, Pepsi Co Inc, Nestle, Otsuka Pharmaceutical, FIJI Water Company LLC, Voss Water, National Beverage, Spadel, and Bisleri International are some of the key players in the market. Several M&As along with partnerships have been undertaken by these players to facilitate customers with hi-tech and innovative products/technologies.
Insights Presented in the Report
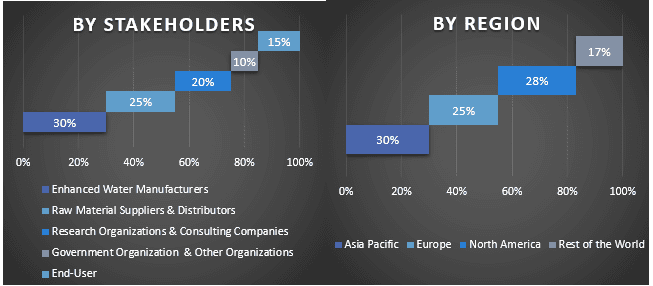
“Amongst water type, alkaline enhanced category is to show dominance in the market”
Based on water type, the market is segmented into nutrient enhanced, electrolyte enhanced, alkaline enhanced, and oxygenated enhanced. The alkaline enhanced category is to show dominance in the market. As alkaline enhanced water is a type of water that has been treated to increase its pH level, typically by the addition of minerals such as calcium, potassium, and magnesium. Additionally, alkaline enhanced water is also used for multiple health benefits, such as neutralizing acid in the body and improving hydration. For instance, in Jul 2022, Booster Water launched a range of Alkaline Ionised water. As Ionised alkaline water helps in increasing hydration levels and elevates oxygen levels in the body amongst other features. It also flushes out acids from the body which helps in protecting humans from diseases and people who suffer from kidney ailments must consume this water.
“Amongst distribution channel, the offline distribution channel is to show dominance in the market.”
Based on the distribution channel, the market is bifurcated into offline and online. Among these, the offline distribution channel is to show dominance in the market. Offline distribution channels include retail stores such as supermarkets, health food stores, and convenience stores. An offline distribution channel offers an advantage over online as offline stores can reach customers who prefer to shop in physical stores rather than online. Furthermore, many government initiatives are taken to regions to help people get a proper enhanced water supply. For instance, in the APAC region specifically, India putting up small purification plants (water ATMs) at stations itself where one can get a bottle filled for USD 0.060 can be seen at Delhi Metro stations and railway stations in Delhi, Chennai, and some other places.
Enhanced Water Market Report Coverage
“APAC is anticipated to grow at a substantial CAGR during the forecast period”
In 2021, APAC is anticipated to grow at a substantial CAGR during the forecast period. This is mainly due to rising health awareness, increasing disposable incomes, changing lifestyles, and growing urbanization in the region. The region has large and diverse populations with varying health needs and preferences in various countries such as China, India, Japan, Australia, and South Korea. Additionally, in China, there is a growing interest in products that claim to enhance cognitive function or boost energy levels, while in India, there is a demand for products that can help alleviate digestive issues. Furthermore, the region has a growing popularity of e-commerce and mobile shopping, which is making it easier for consumers to purchase enhanced water products online. Thus, companies like Coca-Cola and PepsiCo are investing heavily in e-commerce platforms and digital marketing in the APAC region to reach more consumers and build their brands. Thus, escalating the demand for enhanced water in the region.
Reasons to buy this report:
- The study includes market sizing and forecasting analysis validated by authenticated key industry experts.
- The report presents a quick review of overall industry performance at one glance.
- The report covers an in-depth analysis of prominent industry peers with a primary focus on key business financials, product portfolio, expansion strategies, and recent developments.
- Detailed examination of drivers, restraints, key trends, and opportunities prevailing in the industry.
- The study comprehensively covers the market across different segments.
- Deep dive regional level analysis of the industry.
Customization Options:
The global enhanced water market can further be customized as per the requirement or any other market segment. Besides this, UMI understands that you may have your own business needs, hence feel free to connect with us to get a report that completely suits your requirements.
Table of Content
Research Methodology for the Enhanced Water Market Analysis (2022-2028)
Analyzing the historical market, estimating the current market, and forecasting the future market of the global enhanced water market were the three major steps undertaken to create and analyze the adoption of enhanced water in major regions globally. Exhaustive secondary research was conducted to collect the historical market numbers and estimate the current market size. Secondly, to validate these insights, numerous findings and assumptions were taken into consideration. Moreover, exhaustive primary interviews were also conducted, with industry experts across the value chain of the global enhanced water market. Post assumption and validation of market numbers through primary interviews, we employed a top-down/bottom-up approach to forecasting the complete market size. Thereafter, market breakdown and data triangulation methods were adopted to estimate and analyze the market size of segments and sub-segments of the industry pertains to. Detailed methodology is explained below:
Analysis of Historical Market Size
Step 1: In-Depth Study of Secondary Sources:
Detail secondary study was conducted to obtain the historical market size of the enhanced water market through company internal sources such as annual reports & financial statements, performance presentations, press releases, etc., and external sources including journals, news & articles, government publications, competitor publications, sector reports, third-party database, and other credible publications.
Step 2: Market Segmentation:
After obtaining the historical market size of the enhanced water market, we conducted a detailed secondary analysis to gather historical market insights and share for different segments & sub-segments for major regions. Major segments are included in the report as water type, distribution channel, and end-user. Further country-level analyses were conducted to evaluate the overall adoption of testing models in that region.
Step 3: Factor Analysis:
After acquiring the historical market size of different segments and sub-segments, we conducted a detailed factor analysis to estimate the current market size of the enhanced water market. Further, we conducted factor analysis using dependent and independent variables such as various water types, distribution channels, and end-user of enhanced water. A thorough analysis was conducted for demand and supply-side scenarios considering top partnerships, mergers and acquisitions, business expansion, and product launches in the enhanced water market sector across the globe.
Current Market Size Estimate & Forecast
Current Market Sizing: Based on actionable insights from the above 3 steps, we arrived at the current market size, key players in the global enhanced water market, and market shares of the segments. All the required percentage shares split, and market breakdowns were determined using the above-mentioned secondary approach and were verified through primary interviews.
Estimation & Forecasting: For market estimation and forecast, weights were assigned to different factors including drivers & trends, restraints, and opportunities available for the stakeholders. After analyzing these factors, relevant forecasting techniques i.e., the top-down/bottom-up approach were applied to arrive at the market forecast for 2028 for different segments and sub-segments across the major markets globally. The research methodology adopted to estimate the market size encompasses:
- The industry’s market size, in terms of revenue (USD) and the adoption rate of the enhanced water market across the major markets domestically
- All percentage shares, splits, and breakdowns of market segments and sub-segments
- Key players in the global enhanced water market in terms of products offered. Also, the growth strategies adopted by these players to compete in the fast-growing market
Market Size and Share Validation
Primary Research: In-depth interviews were conducted with the Key Opinion Leaders (KOLs) including Top Level Executives (CXO/VPs, Sales Head, Marketing Head, Operational Head, Regional Head, Country Head, etc.) across major regions. Primary research findings were then summarized, and statistical analysis was performed to prove the stated hypothesis. Inputs from primary research were consolidated with secondary findings, hence turning information into actionable insights.
Split of Primary Participants in Different Regions
Market Engineering
The data triangulation technique was employed to complete the overall market estimation and to arrive at precise statistical numbers for each segment and sub-segment of the global enhanced water market. Data was split into several segments & sub-segments post studying various parameters and trends in the areas of water type, distribution channel, and end-user in the global enhanced water market.
The main objective of the Global Enhanced Water Market Study
The current & future market trends of the global enhanced water market were pinpointed in the study. Investors can gain strategic insights to base their discretion for investments on the qualitative and quantitative analysis performed in the study. Current and future market trends determined the overall attractiveness of the market at a regional level, providing a platform for the industrial participant to exploit the untapped market to benefit from a first-mover advantage. Other quantitative goals of the studies include:
- Analyze the current and forecast market size of the enhanced water market in terms of value (USD). Also, analyze the current and forecast market size of different segments and sub-segments
- Segments in the study include areas of water type, distribution channel, and end-user.
- Define and analysis of the regulatory framework for the enhanced water
- Analyze the value chain involved with the presence of various intermediaries, along with analyzing customer and competitor behaviors of the industry.
- Analyze the current and forecast market size of the enhanced water market for the major region.
- Major countries of regions studied in the report include Asia Pacific, Europe, North America, and the Rest of the World.
- Company profiles of the enhanced water market and the growth strategies adopted by the market players to sustain in the fast-growing market
- Deep dive regional level analysis of the industry
Related Reports
Customers who bought this item also bought
Middle East & Africa Bath and Shower Product Market: Current Analysis and Forecast (2025-2033)
Emphasis By Product Type (Bath Soaps, Body Gels, Bath Additives, and Others), by Product Form (Solid, Gels and Jellies, Liquid, and Others), By End-Users ( Men and Women), by Distribution Channel (Online stores and Offline stores), By Country (Saudi Arabia, UAE, Egypt, South Africa, Turkey, Israel, and the Rest of Middle East & Africa)
Southeast Asia Online On-Demand Home Services Market: Current Analysis and Forecast (2025-2033)
Emphasis on Platform (Mobile Application, Web Portal); Service Type (Home Cleaning, Repair & Maintenance, Beauty & Wellness, Pest Control, Laundry & Dry Cleaning, Moving & Relocation, Others); End User (Residential Users, Commercial Users); and Country.
Sage Essential Oil Market: Current Analysis and Forecast (2025-2033)
Emphasis on Source (Organic and Inorganic); Application (Aromatherapy, Cosmetics & Personal Care, Pharmaceuticals, Food & Beverages, and Others); Distribution Channel (Online and Offline); and Region/Country
Middle East & Africa Cat Litter Product Market: Current Analysis and Forecast (2025-2033)
Emphasis By Product Type (Clumping and Conventional), By Raw Material (Clay, Silica, Wood/Bamboo/Sawdust, Paper, Soy, Corn/ Grain, and Others), by Distribution Channel (Offline (Supermarket/Hypermarkets, Specialty Retail Stores, Convenience Stores & Others), and Online), By Country (Saudi Arabia, UAE, Egypt, South Africa, Turkey, Israel, and the Rest of Middle East & Africa)